
This site began idea began from my engagement with MSU researchers after the Flint Water Crisis where we focused on mapping food resources that help mitigate lead in the body (high calcium and high vitamin C foods).
More recently I started noticing that many Flint mapping efforts from the Flint Water Crisis time period were disappearing, breaking, or have been removed altogether.
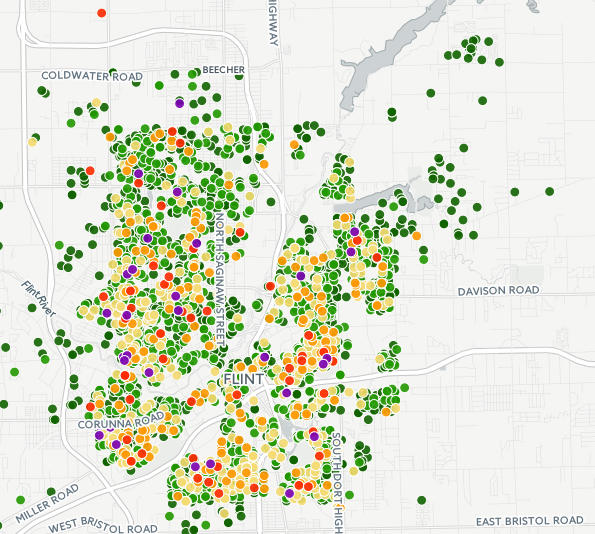
One such map was this one from PBS that they mapped on a now assumedly defunct Carto account and the link provided to the State of Michigan’s datasets returns an Error 404 showing the page no longer exists. From the article:
“We mapped the results of these lead tests for the month of January. These are tests of people’s drinking water more than two months after the city switched back to Lake Huron water from Detroit. We could confirm the addresses of 4,051 drinking water tests in Flint for the month of January. We grouped the lead results into six ranges.
- 0 ppb: no lead detected in the drinking water
- 1-4 ppb: the EPA deems this range as acceptable
- 5-14 ppb: exposure is a concern, but still below an EPA “federal action level”
- 15-49 ppb: a range above the federal action level for lead, but can be treated by filters
- 50-149 ppb: reaching dangerous levels, but can be treated by filters
- 150 and above: a range at which the federal government says water filters might not work”
Archival map work is critical in the digital age where many of these project can disappear in a moment with no physical backup, no archived datasets, and unfortunately all that is left is a random digital image.

Leave a comment